At Unlimited Petroleum Consulting, our goal is to provide strategic solutions in the area of Artificial Lift and Production Optimization of oil wells using Echometer technology, well completion equipment, software for the optimization of mechanical pumping and progressive cavity.
It is for this reason that we will explain the Enriched Curves (EIPR) used for the simultaneous selection of target flow and depth for the installation of the pump with simultaneous visualization of the free gas conditions taking into account the work of the specialized engineers in the subject.
During the pump sizing, artificial lift (AL) engineers usually deal with the problem of deciding the setting depth of the pump and the target production rate. There is a trade-off regarding the pump’s depth; the deeper the pump, the lower the free gas, the higher the potential rate, the higher the submergence but the higher the cost, and the higher the temperature.
In order to avoid this trial and error process the Enriched Inflow Performance Relationship (EIPR) curves at pump intake for different setting depths, each one showing points highlighted using a color scale to indicate free gas conditions into the pump. The free gas displayed mainly depends on the Pump Intake Pressure, Bubble Point Pressure, GOR, Water Cut, downhole gas separation efficiency. Since the reservoir performance is included, these EIPR Curves easily allow simultaneous selection of target rate and pump setting depth while visualizing free gas conditions which avoids the trial and error process showing a more realistic application window of the method.
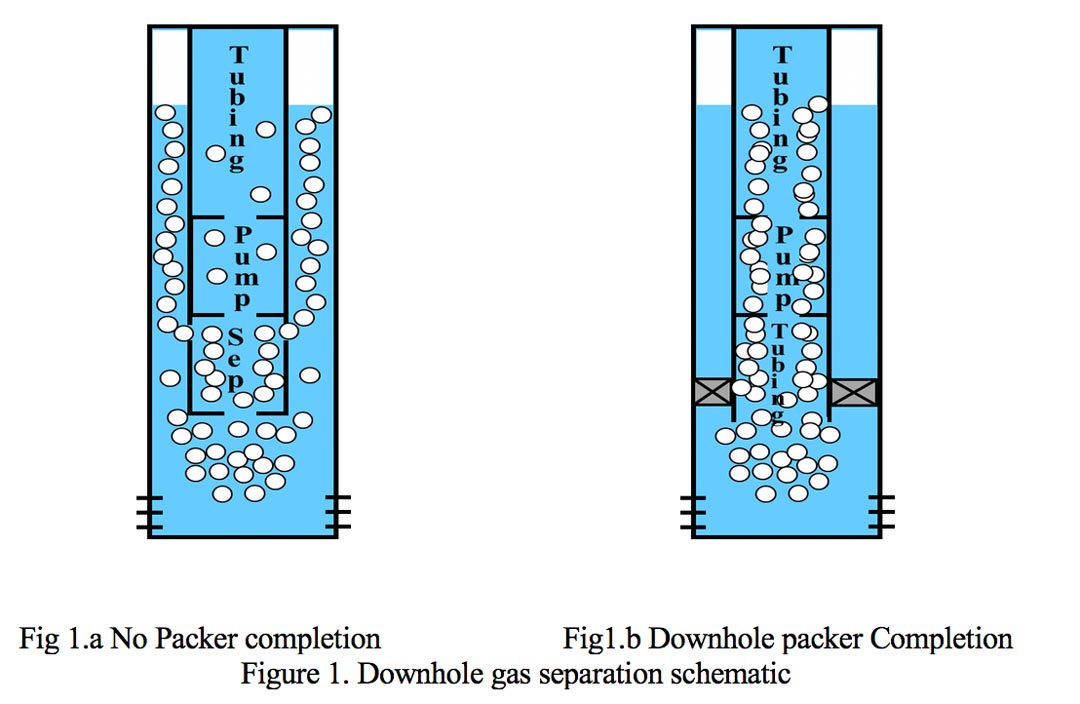
All the free gas (white) bubbles liberated by the oil coming from reservoir arrives at separator intake, then the biggest percentage (depending on the gas separation efficiency) of the gas is expelled to the annulus, meanwhile the remaining free gas comes into the pump together with all the liquid (blue) which takes into account the oil, water and the solution gas. Therefore, the equation that defines the free gas percentage is given by:

Can be rewritten Using the Gas Oil ratio and the solution gas Rs

There are factors that can be simplified, besides the gas equation to account for gas expansion must be included, and finally taking care of units the conversion factor (5.615) to transform barrel feet into cubic feet is introduced.

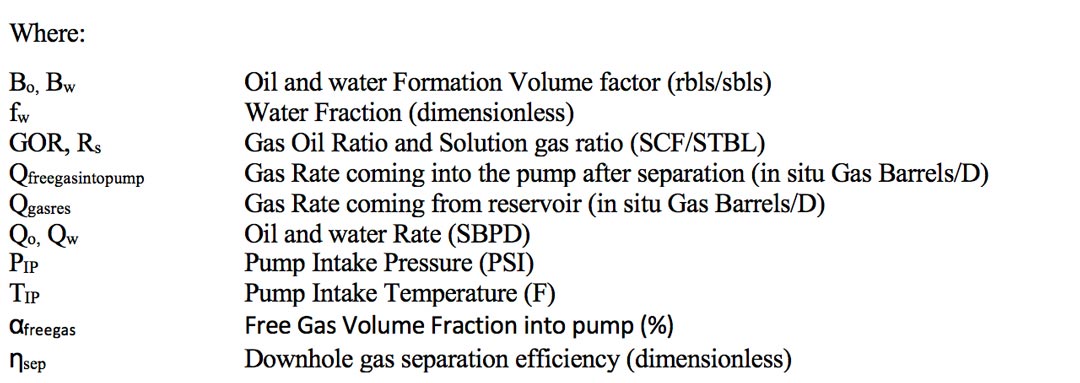
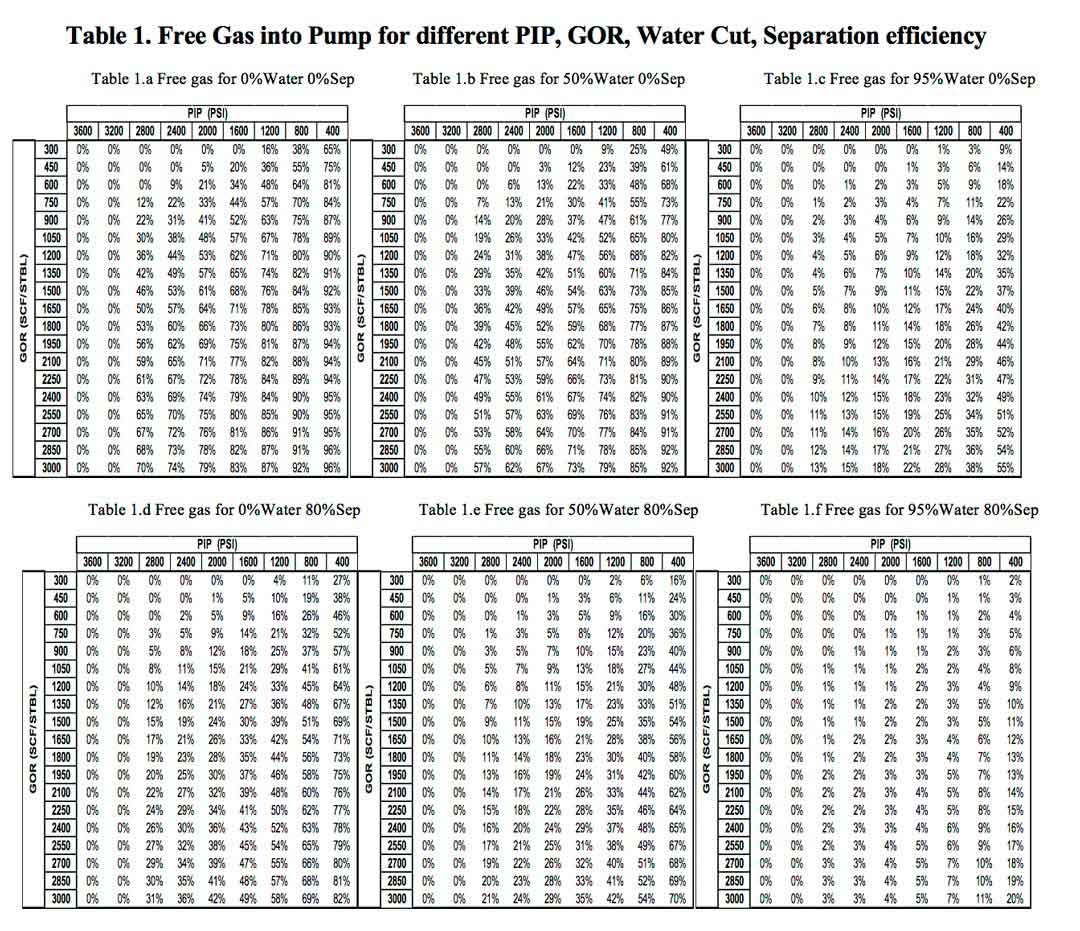
Equation 3 deserves to be analyzed carefully before proceeding to the final goal of this paper. First of all, it is clear that the free gas percentage into the pump not only depends on GOR but also on other important parameters, being the pressure, the solution gas Rs, the water cut and the downhole separation efficiency those with major effect. Temperature and volume factor have a minor effect. As matter of clarification and quantification the table 1 provides some Free Gas into Pump magnitudes as a matter or reference for different PIP, GOR, water cut, separation efficiency having constant bubble Pressure 3200 PSI, API 38, T 250F.
Notice that in table 1.d that there are many combinations of GOR and PIP that have same free gas. In fact, GOR=300 & PIP=400 has 27% as well as GOR=2550 & PIP = 2800, so what is considered low GOR has the same problem that what is considered high GOR just because of the PIP. Finally, the water cut effects shows that as the water increases the free gas reduces for the same GOR and PIP. At high water cuts the effect of free gas is overwhelmed by the water, this can be appreciated in the equation 4 that the water term in denominator becomes predominant which will reduce the fraction
The Enriched Inflow Performance Relationship (EIPR) Concept
First step to reach our goal is to plot the IPR at different setting depths, as many as desired and separated some fix distance each other. In the example the perforations are at 10000 ft., so let’s plot IPR at 6000, 7000, 8000, 9000, 10000 and 11000 ft which represents pump installed above, at and below perforations. Notice that at this point no decision about the setting depth has been done.
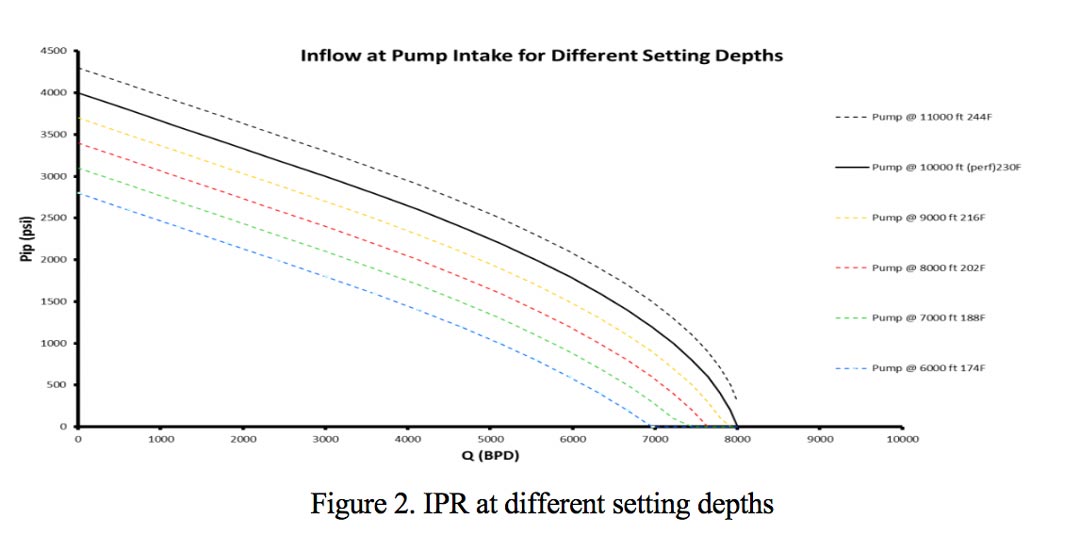
These curves can be plotted regardless of the pumping method (ESP, PCP, SRP, JP) so it can be applied even before selecting the pump method or selecting the target rate or the setting depth. A final step is pending because the free gas is not shown but keeping in mind these curves provide the pressure corresponding to target rate then the free gas calculation can be done. However, the value will change for every rate and setting depth, so one way to do it is by plotting points over each IPR with a color code that indicates the corresponding free gas as it is shown in Figure 5.
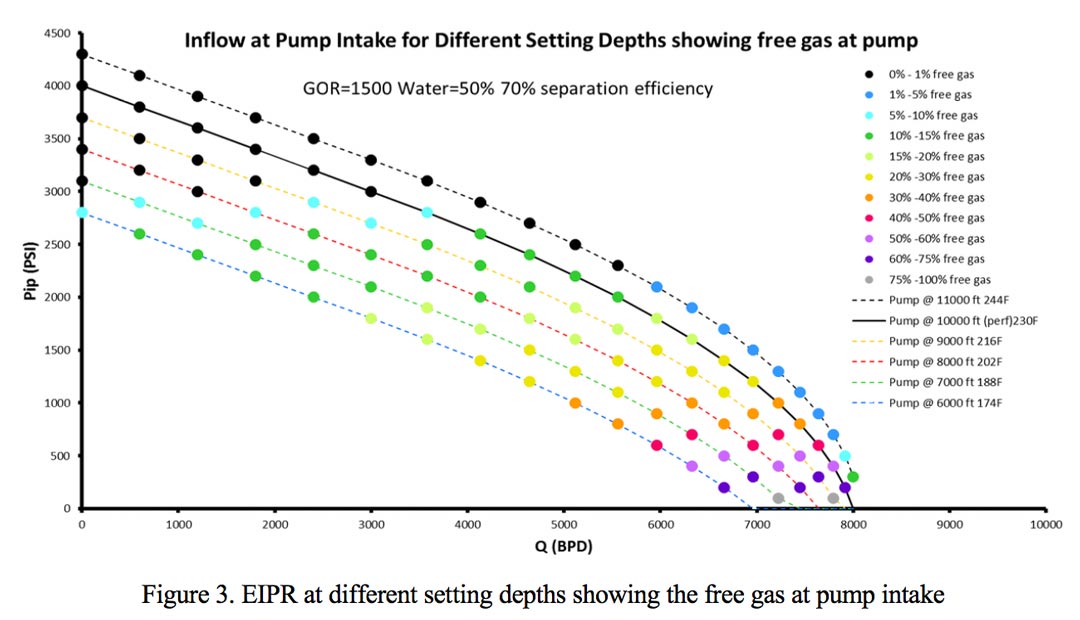
The EIPR concept is shown in figure 3. The color code is shown in the legend, the black represents those points having 0%-1% of free gas, the dark blue the points with 1%-5% of free gas and so on. As expected, for a fixed pump depth the free gas increases as the flow rate increases because the PIP decreases which can be appreciated with different colors over the same IPR. On the other hand, for a fixed rate the free gas increases as the setting depth decreases, again because the PIP decreases, For example at 3500 BPD the free gas would be 0%-1% at 11000 ft, 1%-5% at 10000 ft, 10%-15% at 9000 ft, 15%-20% at 7000 ft and 20%-30% at 6000 ft.
The Enriched IPR curve not only provides useful information but also proposes a new paradigm design for pumping methods. So instead of guessing the target rate and the setting depth and check if it is possible, then it is much better to start with the free gas percentage the engineer considers is feasible and then check which the possible rates are and setting depths having this condition. For example, in figure 5, let’s say that engineer wants to have maximum 10% free gas into the pump, so the options would be to install the pump below perforations (11000ft) and produce almost 8000 BPD taking advantage of the high separation efficiency associated with this configuration but assuming all the challenges associated. Another option is to install at perforations and produce around 3500 BPD or install at 8000 ft and produce 2000 BPD or install at 7000ft and produce 1200 BPD. As can be appreciated EIPR curves allows selecting the setting depth and the target rate while visualizing the free gas conditions.
Another important benefit is that EIPR curves provide an easy concept to explain and communicate with non-AL specialists. For example, let’s say the reservoir engineer wants to produce above bubble point in the porous media, in addition the drilling engineer wants to save money having the liner as shallowest as possible and the AL engineer wants to have less than 15% of free gas into the pump and the pump above the liner because the lack of space to install a Y-Tool. The EIPR show that at perforations 3000 BPD would have pressure above bubble point and at the same time shows that it is possible to have the pump at 7000 ft having the free gas below 15% but at 6000 ft the free gas is above 15%, so the liner cannot be above 7000 ft. This example shows that EIPR curves allow reservoir, the drilling and the AL engineer agreeing about a feasible and satisfactory rate and setting depth.
The EIPR curves are essential for specialized engineers to perform an adequate and satisfactory artificial survey, making it easy to choose the target flow, visualizing at all times the conditions in which the oil and free gas deposit is located, allowing the installation depth to be selected, It also helps to make the communication of the team of experts more effective as it is a tool that explains and informs the objective of what is to be achieved.
In Unlimited Petroleum Consulting we are focused on satisfying our clients, providing integrated solutions for the oil and industrial sector, guaranteeing the quality of service, supported by a qualified team of specialists in each area.
Below we present some conclusions and final recommendations to take into account what is stated in this article:
- The EIPR concept is an innovative, useful and feasible idea that allows the simultaneous selection of target rate & pump setting depth while visualizing free gas and reservoir conditions that applies for ESP, SRP, PCP and JP.
- The EIPR curve allows and proposes a new approach to design for pumping methods that starts with the free gas pumping capacity and then selecting a feasible production rate and corresponding pump setting depth.
EIPR curves provide an easy concept and tool to explain and communicate with non-AL specialists about the target, pump setting depth and free gas conditions as well as other parameters such as total rate and estimated power.
